Data Release 2 information
Summary
- Announced: March 30, 2021
- Area: 950.5 deg2
- Astrometric error: < 0.2 arcsec
- Depth:
g = 21.3 mag for S/N > 3 - List of tiles with central coordinates: DR2_list_fields.csv
DR2 observations
The DR2 observations span a broad time period, from August 2016 to February 2020. During this time, the only significant interruption happened between April and November 2017, when a series of technical issues were identified and fixed during the science verification phase. In total, the DR2 contains observations taken during 273 nights, corresponding to a total exposure time of 630 hours (considering all 12 filters). The data is available at the S-PLUS database splus.cloud. The figure below shows the nights where at least one DR2 observation took place. The darker the color, the higher is the number of observations during that night.

The T80S operation is automatically performed by the observatory control system. Every night, observations are planned to take into account the date, the moon's position and luminosity and a set of predefined fields and sub-surveys priorities. During the observations, an automatic supervisor algorithm is present to also take the weather conditions into account and execute the necessary changes to the observation schedule. Human interventions are also occasionally applied to ensure the best use of the telescope time.
During standard conditions, the S-PLUS Main Survey, which comprises the DR2 data, is the one that receives the highest priority. It is removed from the schedule during the nights close to the full moon, and also when the seeing conditions are below ~2.5 arcsec, ensuring that the Main Survey data is the top quality that the T80S can provide.
Data Reduction
The raw imaging data of S-PLUS are processed daily and data catalogs are generated at the data center, located in the T80-South technical room, in Cerro Tololo, Chile.
The S-PLUS raw data are reduced using a version of the same data processing pipeline jype that is used to process data for the J-PLUS and the J-PAS surveys, and it is based on the photometric pipeline originally developed for the ALHAMBRA survey (see Cristobal-Hornillos et al. 2009; Molino et al. 2014; Benitez et al. 2014) and the CLASH surveys (Molino et al. 2017).
- Generating a master bias;
- Creating a master flat;
- reducing the individual frames, and combining the individual frames into the final astrometrically-aligned images.
- Bias frames are obtained every night and twilight flats are obtained whenever the sky is clear, at dawn and at dusk. Twilight flats work well for our purposes. Bias and twilight flat fields are stable over a period of about a month and therefore master bias and master flats are obtained for such a period, encompassing the observations of the object. Master flats are obtained for each filter. Only flat fields with counts between 13000 and 42000 counts are used. Overscan subtraction, trimming and bias subtraction is applied to each individual flat field. Master flats are then created by obtaining, for each pixel, the median value with 3 sigma clipping, of all usable flats of a given filter, after scaling each image by its mode. This is performed using the task imcombine of iraf with options median, sigclip, scale=mode and zero=none. Finally, the master-flats are normalized to have a median of unity.
The reduction of individual images consists of applying the overscan subtraction, trimming, bias subtraction and masterflat division. Then cosmetic corrections (removing satellite tracks and cosmic rays) and fringing subtraction are performed. Satellite track and cosmic ray subtraction are performed using either SatDetect in the first case and LACosmic (van Dokkum 2001) or retina filter in the second case, both from SExtractor. Fringing frames are obtained by combining the final individual frames that suffer from fringing, usually only in the z filter. The fringing patterns are stable over several months, so a single fringing frame is made by combining all images over such a period that do not have any bright objects. The last step is, then, the combination of the individual images, which is done by obtaining the median, with 3 sigma clipping, pixel by pixel, for typically three images of each field and filter. This is performed using the task imcombine of iraf with options median, sigclip, scale=none and zero=mode.
Photometry
Almeida-Fernandes et al. 2021 show the procedure adopted in S-PLUS for catalog production. The S-PLUS photometric pipeline is based on the SExtractor software. Photometric catalogs are constructed in double-image mode to perform multi-band aperture-matched photometry. Detection images are created as a weighted-combination of the reddest (griz) broad-band filters to maximize the detectability of faint (or low-surface brightness) sources and to enhance the definition of the photometric apertures. Magnitudes for non-detected sources on individual images are set to m = 99 and corresponding uncertainties replaced by upper-limits. Photometric zero-point calibrations have been performed for every pointing using a novel technique optimized for wide-field multi-band photometric surveys (Almeida-Fernandes et al, 2021).
As explained in Almeida-Fernandes et al. (2021) the catalog includes both astrometric, morphologic, photometric and photo-z information for all detected sources in the S-PLUS detection images. The following parameters were extracted from the images, among others: celestial coordinates (RA, Dec) in the J2000 system, physical position on the CCD (X,Y), photometric aperture size (ISOarea), the signal-to-noise (s2nDet; defined as FLUX_AUTO/FLUXERR_AUTO on the detection image), compactness (FWHM and MUMAX), basic shape parameters (A, B & THETA), the fraction-of-light radii (FLUX_RADIUS) and Kron apertures (KRON_RADIUS). For a list of all the parameters available see Table 5 of Almeida-Fernandes et al. (2021, submitted).
We have also included the standard SeXtractor photometric Flags (PhotoFlag) for both the detection and each filter images. The meaning of each of these flag numbers is the following:
- 1: The object has neighbours, bright and close enough to significantly bias the MAG_AUTO photometry, or bad pixels,
- 2: The object was originally blended with another one,
- 4: At least one pixel of the object is saturated,
- 8: The object is truncated (too close to an image boundary),
- 16: Object's aperture data are incomplete or corrupted,
- 32: Object's isophotal data are incomplete or corrupted,
- 64: A memory overflow occurred during the deblending,
- 128: A memory overflow occurred during the extraction.
Objects with different flag numbers have a combination of the already mentioned flags, the number being the sum of the different flags.
The catalog contains determinations of the photometry of a source in several apertures, where the magnitudes (and uncertainties) are named according to the filter's name and the adopted photometric aperture. The S-PLUS magnitudes are given in the AB photometric system and are not corrected for ISM extinction. The apertures included in DR2 are ‘AUTO’, ‘PETRO’, ‘ISO’, ‘APER_3’, ‘APER_6’, ‘PS_TOTAL’, defined as follows:
- AUTO: Adaptative scaled aperture based on Kron’s “first moment” algorithm.
- PETRO: Adaptative scaled elliptical aperture based on Petrosian’s photometric estimator.
- ISO: Isophotal area defined as the number of pixels with values exceeding 3 sigma thresholdAPER_3: circular fixed apertures of 3" diameter.
- APER_3: circular fixed apertures of 3" diameter.
- APER_6: circular fixed apertures of 6" diameter.
- PSTOTAL: circular fixed apertures of 3" diameter + aperture correction.
Ex. the u band magnitude for the PETRO aperture is called u_PETRO and its uncertainty is called e_u_PETRO.
An estimate of the signal-to-noise for every detection, within each aperture, is also provided as “s2n_J0660_auto”, for example. The signal-to-noise is defined as explained before for the detection image.
Calibration
We developed a novel technique to perform the photometric calibration of S-PLUS, which is described in Almeida-Fernandes et al. (2021). This methodology takes advantage of other previously calibrated large area surveys in the same area (like SDSS, Skymapper, PanSTARRS, etc). The technique uses a combination of libraries of stellar models and the stellar locus of main-sequence stars, applied to typically ~1500 stars per field, bringing all zero-points to a typical error smaller than 0.04 magnitudes for the blue filters (u to J0430) and smaller than 0.03 for the remaining red filters. Instead of correcting the catalogs for ISM extinction, we leave it as another free parameter to be fit by the models. Therefore, we do not rely on photometric transformations and extinction maps, which normally contribute to increasing the final uncertainties. We also avoid the use of stellar locus for filters like J0378 and J0395 which have a naturally large spread in color-color diagrams, making it difficult to properly characterize the stellar locus even if the photometric uncertainties were negligibly small.
Photometric Depth and Completeness
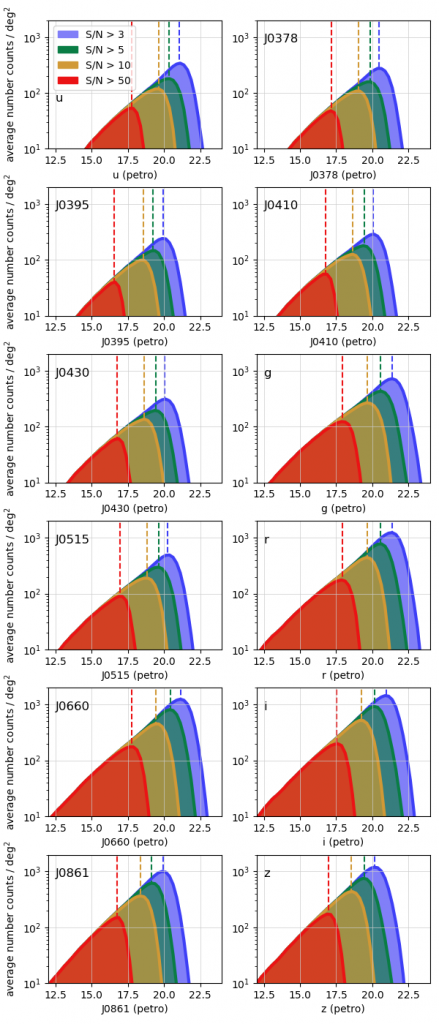
The figure above shows a filter-by-filter analysis of the average photometric depths of the whole DR2. By design, different filters will have significant differences in photometric depth. The filter J0660, for example, reaches much deeper magnitudes in comparison to the other narrow bands due to a larger exposure time (see Table 3 of Mendes de Oliveira et al. 2020), which was chosen to allow S-PLUS to produce H-alpha emission maps. Nevertheless, the S-PLUS MS observations are all done under similar photometric conditions, and we do not expect significant variations of photometric depths for different pointings for the same filter.
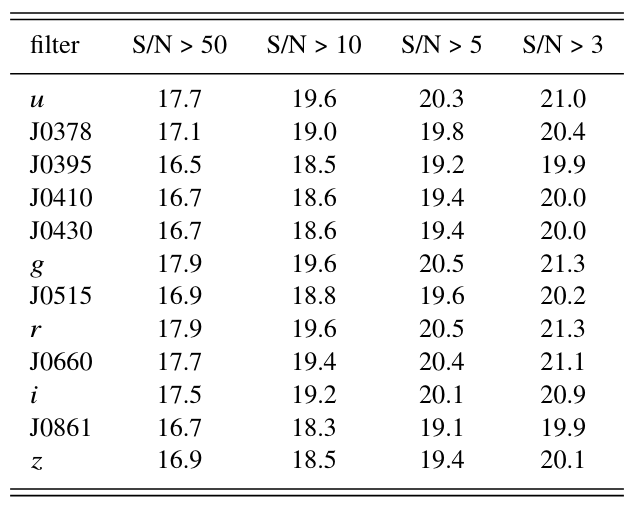
The photometric depths, defined as the peak of the magnitude distribution, is given in the table below for each filter and four S/N thresholds.
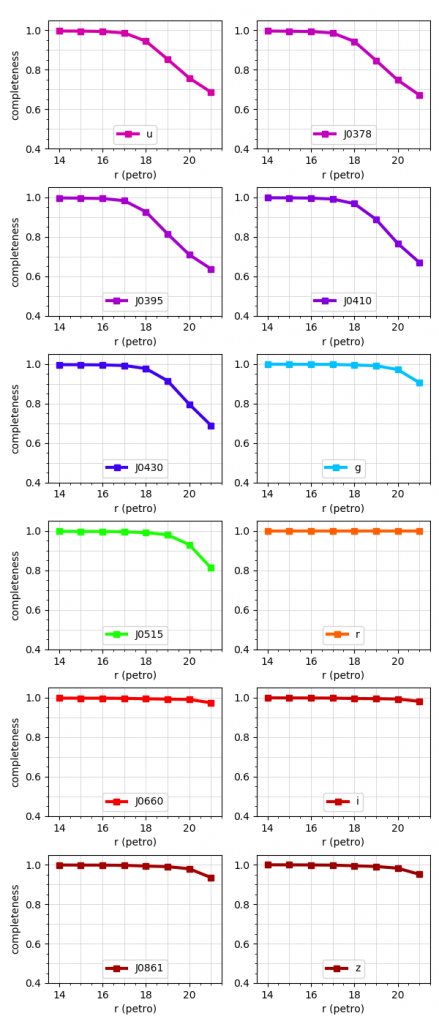
The exposure times and differences in sensitivity of the filters create selection effects in the final catalogs. The figure above shows the fraction of sources that are observed in a particular bin of R magnitude that is also observed in each of the other filters. The R band was chosen as the reference because it is the filter with the highest number of detections.
Contact
We strongly encourage you to contact our team for any questions, criticism and suggestions you may have. See the contact list below.
General: Claudia Mendes de Oliveira (claudia.oliveira@iag.usp.br)
Observations and reduction: Fábio R. Herpich (fabiorafaelh@gmail.com)
Calibration: Felipe de Almeida-Fernandes (felipe.almeida.fernandes@usp.br)